The Models
Forecasts come from national weather services through Open-Meteo. Each model keeps the same color everywhere on the site. When a model's range ends, it drops out of a total rather than being stretched to fit.
ECMWF IFS 9 km grid
European Centre for Medium-Range Weather Forecasts
Europe’s flagship physics model and the benchmark for global forecast accuracy.
GFS 13 km grid
NOAA, United States
NOAA’s global model. The longest range in the set, out to 16 days.
ICON 13 km grid
Deutscher Wetterdienst, Germany
Germany’s global model, out to about seven and a half days.
GEM 2.5–15 km grid
Environment and Climate Change Canada
Canada’s model system, with high resolution over Canada and the northern US.
UKMO 10 km grid
Met Office, United Kingdom
The UK Met Office global model, out to about seven days.
HRRR 3 km grid
NOAA, United States
NOAA’s storm-resolving model, rerun every hour. Lower 48, next 48 hours.
ECMWF AIFS 25 km grid
European Centre for Medium-Range Weather Forecasts
ECMWF’s machine-learning model, trained on decades of past weather.
NBM 2.5 km grid
NOAA National Blend of Models
NOAA’s calibrated blend of many models. Covers the lower 48 and border areas.
One Snowfall Method for Every Model
Weather models forecast precipitation as water. Turning that water into inches of snow takes a snow-to-liquid ratio, and that ratio swings from about 8:1 for wet snow near freezing to more than 20:1 for cold, dry powder.
Open-Meteo's feed converts most models at a fixed ratio near 7:1 but passes NOAA's blend through at the blend's own, much higher ratio. Compared directly, the blend looks two to three times snowier than everything else. That gap comes from the conversion, not the weather.
This site recomputes snowfall for every model the same way, hour by hour, from that model's own precipitation and temperature:
- Temperature is adjusted to the elevation you are viewing (base, mid-mountain or summit) at the standard rate of 3.6 °F per 1,000 ft.
- The share falling as snow is 100% at 32 °F and below, tapering to none at about 36 °F.
- The snow ratio follows the Kuchera method, which ties ratio to temperature, capped at 22:1.
| Temperature | Snow ratio |
|---|---|
| 32 °F | 8:1 |
| 28 °F | 12:1 |
| 23 °F | 15:1 |
| 15 °F | 19:1 |
| 5 °F | 22:1 |
Differences between models now come from what they forecast, which is the comparison worth making.
Consensus and Agreement
The headline number for any period is the median of the models that cover the whole period. The median ignores a single outlier that would drag an average. Next to it is the full range, lowest model to highest.
Model agreement compares the spread of the middle half of the models with the median. High means that spread is under about a third of the median; low means it exceeds three quarters of it. Small totals use a two-inch floor, so a day of flurries does not read as a disagreement. Fewer than three models is too few to judge.
Days are local calendar days at each place. Today counts from the current hour.
Measured Snow from SNOTEL and CDEC
The USDA Natural Resources Conservation Service runs SNOTEL, a network of more than 900 automated snow stations across the western US and Alaska. Each place is paired with up to three stations within 19 miles, favoring stations near the forecast elevation.
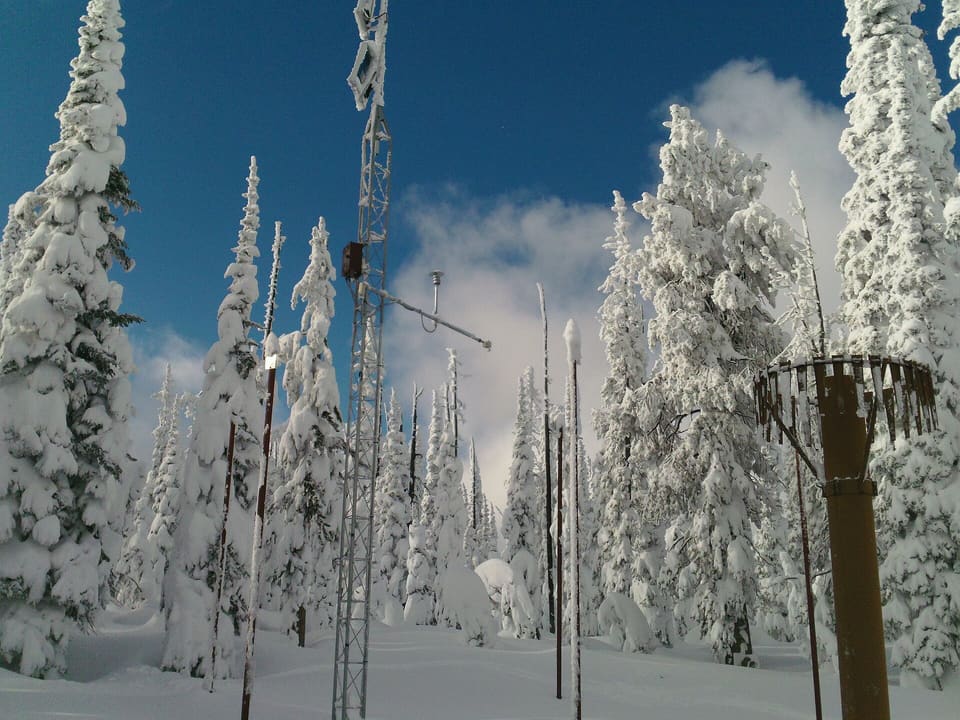
SNOTEL has no station within 19 miles of China Peak, Dodge Ridge, June Mountain, Mammoth Mountain and Mt. Shasta Ski Park. Their readings come from the California Data Exchange Center (CDEC), which the California Department of Water Resources runs. CDEC publishes hourly data from snow stations operated by state, federal and local agencies and utilities; the Snow Report names the operator of the station shown.
Both networks measure snow depth, not new snowfall. New snow settles as it lands, so a depth change runs below the amount that fell. It is labeled as a depth change for that reason. Readings are smoothed over three hours to remove sensor jitter. CDEC's hourly data include sensor errors, so for CDEC stations this site also drops readings CDEC flags and any reading that differs from the last good one by more than 6 inches plus 6 inches for each hour between them.
Snowpack vs. normal compares today's snow water with the 1991–2020 median for the same date, when the station has one. This site has those medians for SNOTEL stations only.
Freshness
Forecast and station data refresh about every 15 minutes. Global models publish new runs every 6 to 12 hours; HRRR runs every hour.